

|
Lets Start to Draw a SN Light Curve |
Main Page |
General Usage Guidelines.
Jump to different tasks here!
- Set the switches to the desired positions, enter appropriate
names in the fields of Internet form, if necessary. Check your actions
on the set of figures shown for each tasks. Finally press button "Draw" to
display the graph as well as to see data tables for Supernova light curves.
- There are navigation menus with buttons "Top", "Graph", "LC Points", "Bottom"
for quick jumping through the page.
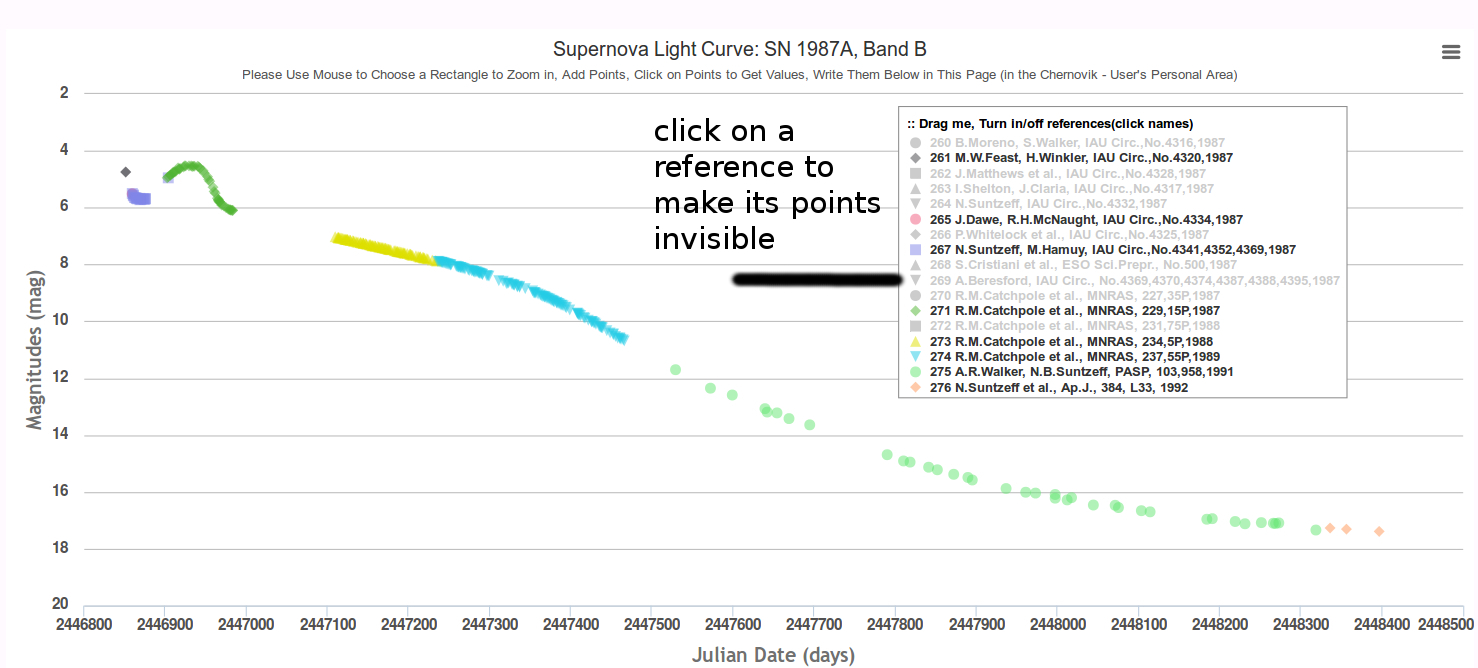
- On the graphic legend, one can enable or disable individual light curves by
clicking on their references.

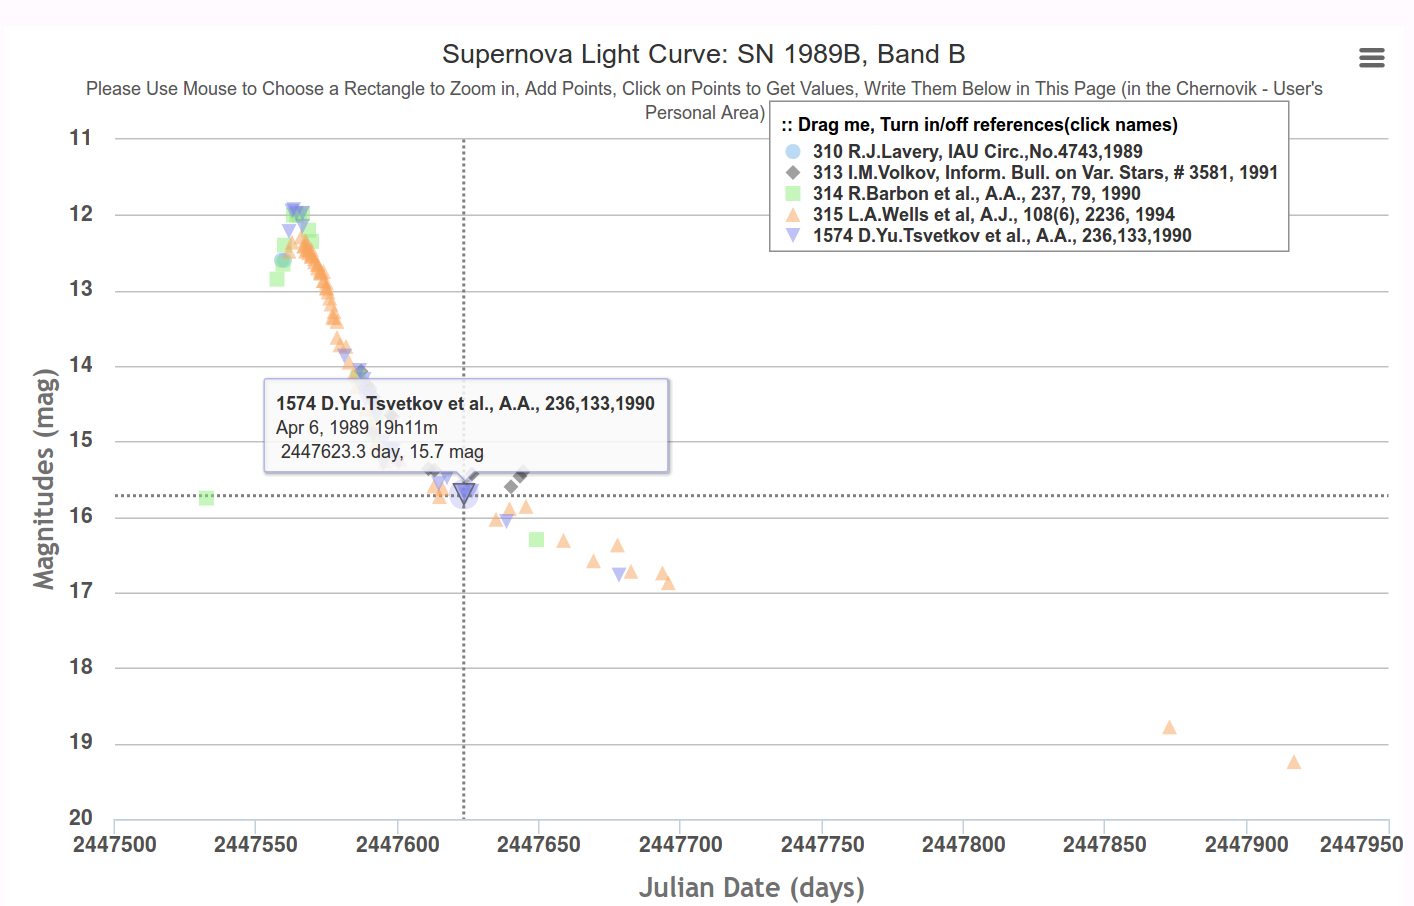
- Moving mouse cursor close to a point of light curve, one can see the values
(days, magnitudes, literature references), associated with this point.

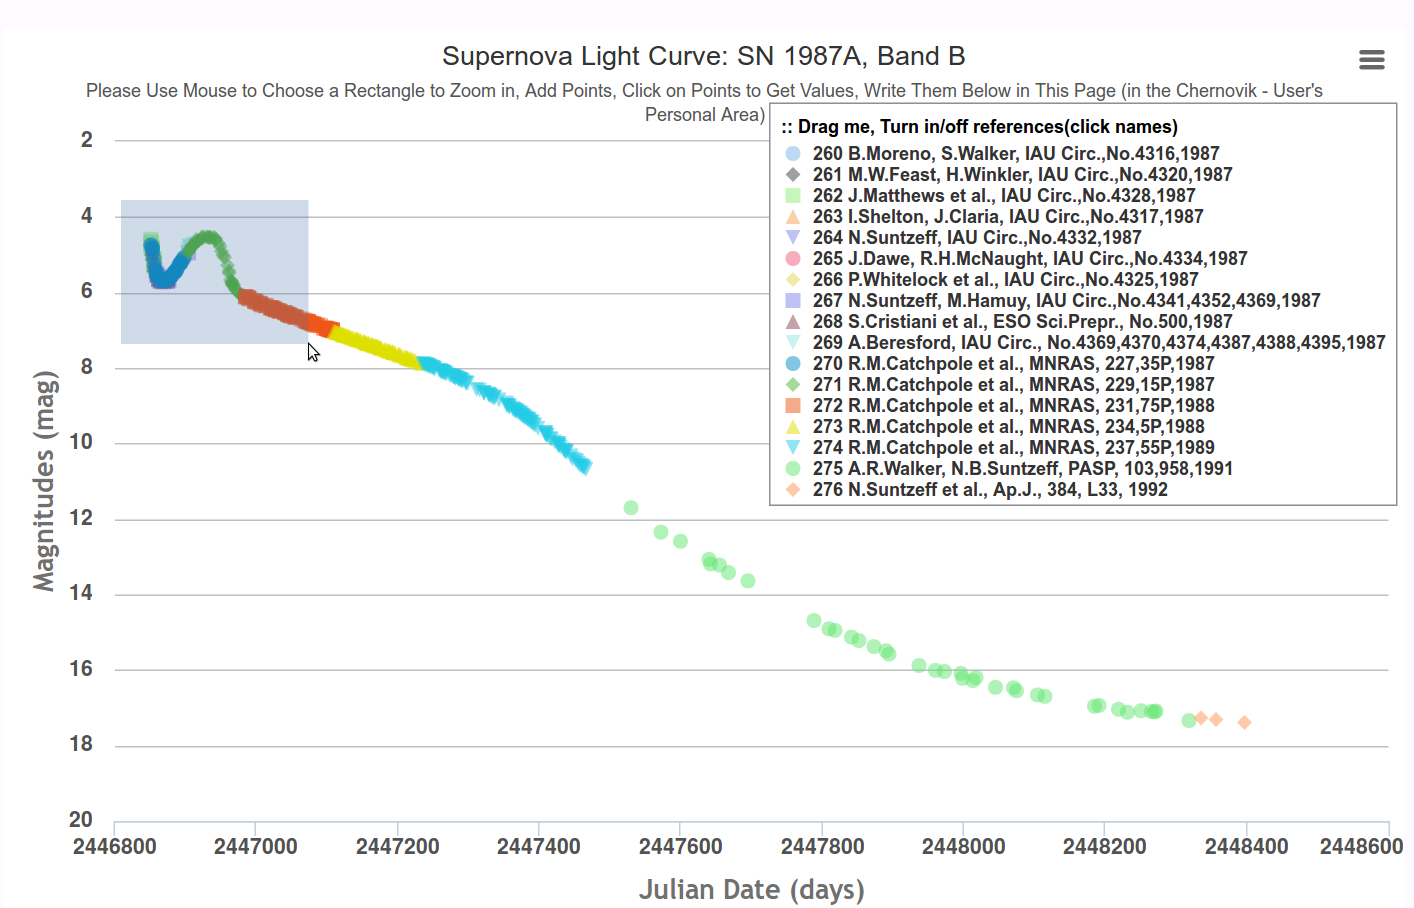
- While pressing the left mouse button and moving mouse through the graph,
one can choose a rectangle of the graph to zoom in. Then one can
press "Reset zoom" to return to the whole graph.


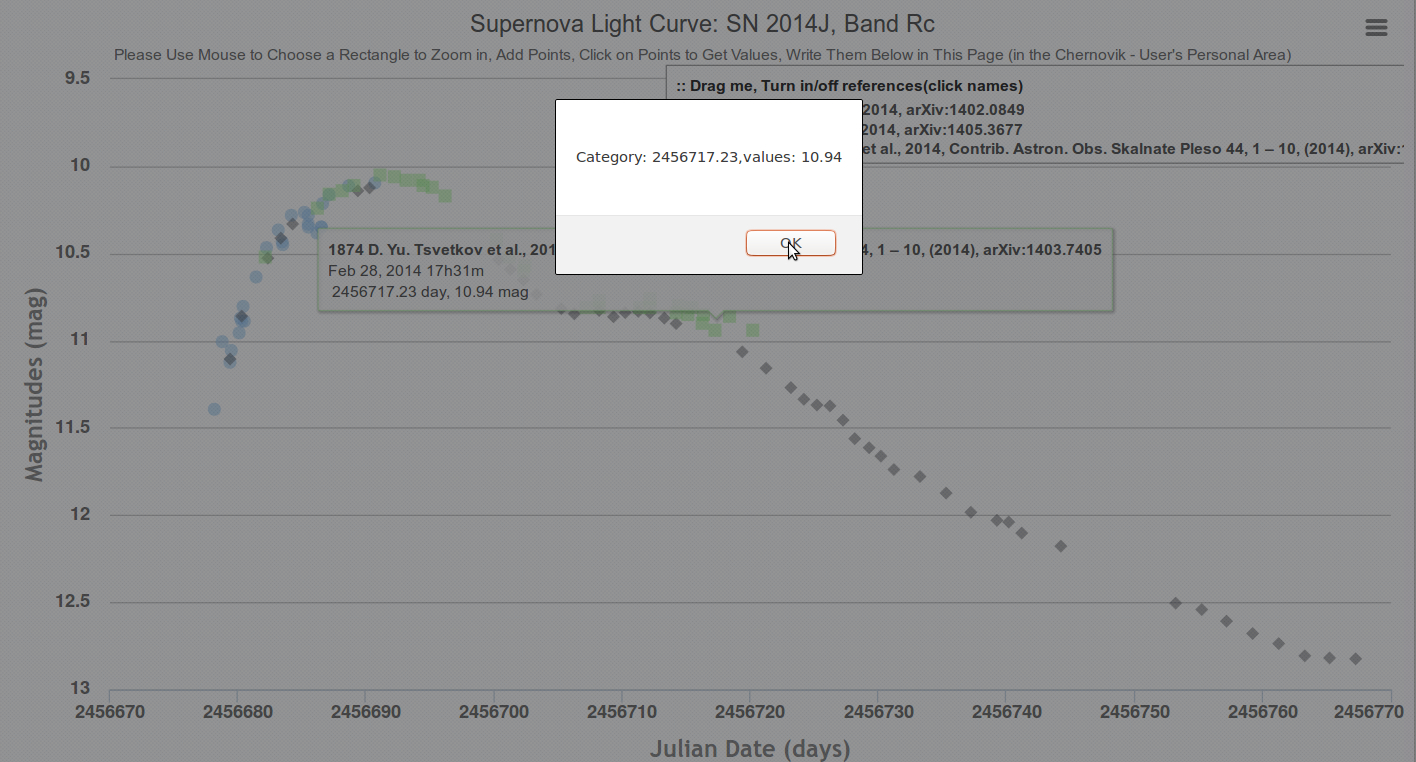
- By clicking left mouse button on the light curve point, one can write
and save the values (day and magnitude), associated with this point.
Also see those values saved at the bottom of page, in the area
"Chernovik".


Basic Tasks
1. To draw an observable (visual) light curve, follow these
steps.
2. To draw a theoretical model light curve, follow these
steps.
3. One can draw both observable and theoretical light
curves.
An example of Professional Task
4. To calculate and study the distance between observable and theoretical
light curves. SN 1999em and Model "mpi_R500_M9_Ni004_E7", band V. (Under
Construction).
| |
(C) ITEP-SAI
Supernova Study Collaboration. Moscow, Russia. 2006-2016.
(C) Lomonosov
Moscow State University, Sternberg Astronomical Institute Supernova Group,
Moscow, Russia (MSU, SAI) |
Supported by grants of RFBR (13-02-92119), "Scientific Schools of Russia (3458.2010.2)".
(C)
Internet site space and support of Alikhanov Institute for Theoretical and
Experimental Physics, Moscow, Russia (ITEP) |
| |


